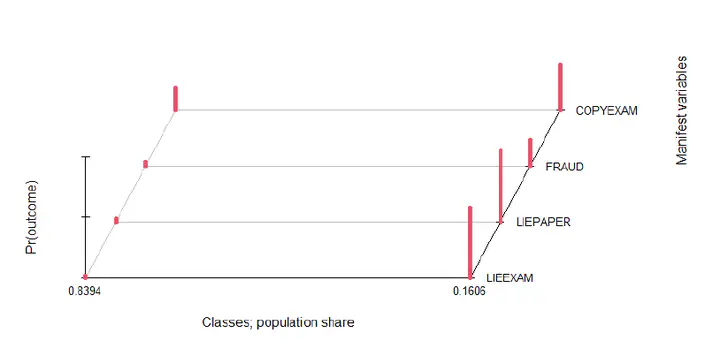
 Unconditional Latent Class Analysis: Class Probabilities and Conditional Results Plot
Abstract
Objective: To demonstrate how to perform latent class analysis (LCA) using the poLCA package of R software.
Methods: Take the data in Dayton’s “Latent Class Scaling Analysis” as an example to illustrate how to use the poLCA package of R software to perform latent class analysis, and show the results after the code run.
Results: The example data was divided into two latent classes with probabilities of 0.839 and 0.161, respectively.
Conclusion: Compared with traditional SAS, STATA, Mplus, and other software, the poLCA package in R software can sequentially perform multiple loops with the number of latent classes and output the optimal model when the number of optimal latent classes is unknown. Latent class analysis with covariates can also be performed, providing researchers with a fast, simple, and convenient latent class analysis method.
of CAD, which could be used as a biomarker for the evaluation of the severity of CAD.