Cohort Study:the The Relationship Between atherogenic index of plasma (AIP) and Collateral Circulation Formation in chronic total occlusive (CTO) patients

In this study, I participated in the research design and conducted a portion of the data analysis, primarily utilizing SPSS software for logistic regression analysis and employing R for net reclassification index (NRI) calculation.
In this project, I published an article as the co-first author
Objective: The atherogenic index of plasma (AIP), determined by the logarithmic transformation of the ratio of triglyceride (TG)
and high-density lipoprotein cholesterol (HDL-C), was found to be a marker of cardiovascular disease. We sought to investigate the
correlation between the atherogenic index of plasma (AIP) and coronary collateral circulation (CCC) formation in chronic total occlusive
(CTOs) patients.
Methods: This retrospective cohort study included 665 non-CTOs and 345 CTOs patients. CTOs were divided into 206
CCC poor formation patients and 139 CCC good formation patients according to the Cohen-Rentrop grade. Spearman correlation analysis
was carried out to obtain the relationship between AIP and the Rentrop grade. We used multivariate logistic regression analysis to assess
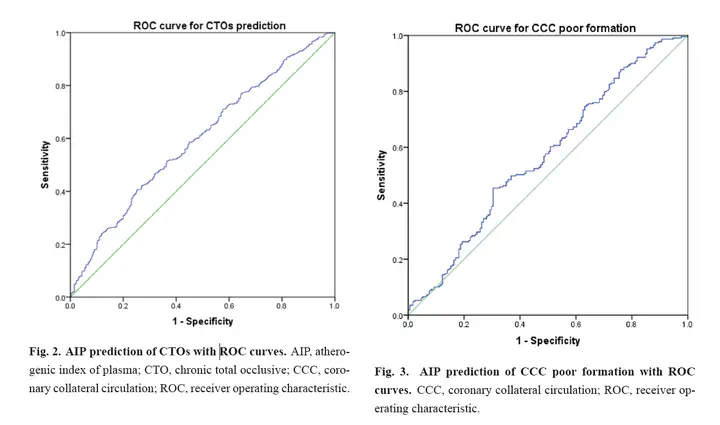
CTOs and CCC poor formation risk factors. Receiver operating characteristic (ROC) curves were used to determine the optimal threshold
for AIP to predict CTOs and CCC poor formation. The predicted increment of AIP on CTOs and CCC poor formation was evaluated by
calculating the Net Reclassification Index (NRI) and the Integrated Discriminant Index (IDI).
Results: AIP in CTOs was significantly
elevated compared to non-CTOs patients [(1.55 (1.02, 2.59)) vs (1.26 (0.82, 1.90)), p < 0.001] AIP in the CCC poor formation group
was significantly higher than that in the CCC good formation group [(1.73 (1.12, 2.90)) vs (1.37 (0.84, 2.13)), p = 0.002]. There was a
negative correlation between AIP and the Rentrop grade (r = –0.145, p = 0.007). The results of multivariate logistic regression revealed
that AIP was an independent predictor of CTOs (OR = 4.371, 95% CI: 2.436–7.844, p < 0.001) and CCC poor formation (OR = 3.749,
95% CI: 1.628–8.635, p = 0.002). In the ROC analysis, the area under the curve of AIP for identifying CTOs and CCC poor formation
was 0.596 (OR = 3.680, 95% CI: 1.490–9.090, p = 0.005) and 0.597 (95% CI: 0.535–0.658, p = 0.002), respectively.
Conclusions: Contrary to previous research, we found that AIP is a moderate but not powerful indicator for detecting both CTO patients and poor CCC
formation.